

Why Ratios Matter More Than Raw Numbers
The raw financial statement numbers that most business owners focus on — total revenue, total expenses, net profit, total assets — are difficult to interpret without context. The business with one million dollars in revenue and fifty thousand dollars in profit is either an excellent or a terrible business depending on its industry, its capital requirements, and its growth trajectory — the absolute numbers do not reveal which. The ratio that expresses profit as a percentage of revenue (the net profit margin of 5%) can be compared against industry benchmarks, against the same business in prior periods, and against competitors — providing the context that makes the absolute number interpretable.
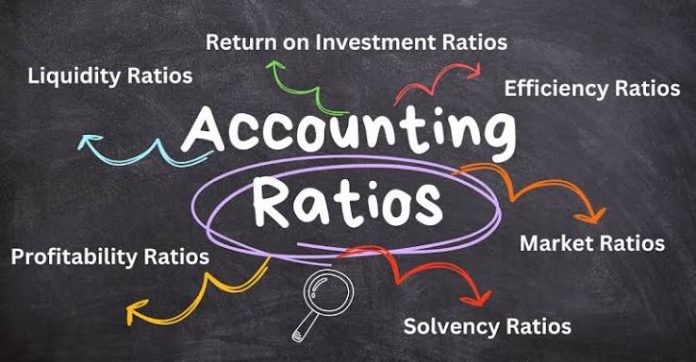
The financial ratio analysis discipline that most efficiently provides a complete picture of a business’s financial health: the examination of ratios across four categories simultaneously — liquidity (can the business pay its short-term obligations?), profitability (is the business generating adequate returns from its operations?), efficiency (is the business using its assets and capital effectively?), and leverage (how much debt is the business using, and is it sustainable?). The business that examines only profitability ratios while ignoring liquidity ratios may miss the cash flow problem that threatens the business despite its profitability; the one that examines only liquidity while ignoring efficiency may miss the improvement opportunities that better asset management would provide.
Liquidity Ratios
The liquidity ratios that most clearly reveal whether a business can meet its short-term financial obligations: the current ratio (current assets divided by current liabilities — a ratio above 1 indicates that current assets exceed current liabilities, providing a buffer against short-term insolvency; ratios below 1 indicate that the business cannot pay all its current obligations from its current assets alone), and the quick ratio (cash plus short-term investments plus accounts receivable, divided by current liabilities — a more conservative liquidity measure that excludes inventory and other current assets that may not be quickly convertible to cash).
The liquidity ratio interpretation that most clearly reveals the difference between apparent liquidity and genuine liquidity: the examination of the composition of current assets alongside the ratio itself. The business with a current ratio of 2.5 that has 80% of its current assets tied up in slow-moving inventory has worse genuine liquidity than the number suggests, because the inventory may not be quickly convertible to cash at full value. The business with a current ratio of 1.2 that has 80% of its current assets in cash and short-term receivables from creditworthy customers has better genuine liquidity than the lower ratio suggests, because those assets can be converted to cash quickly when needed.
Profitability Ratios
The profitability ratios that most clearly reveal the business’s ability to generate profit from its operations and from its capital: the gross profit margin (gross profit divided by revenue — reveals the profitability of the core product or service before operating expenses, reflecting the business’s pricing power and cost of production), the operating profit margin (operating profit divided by revenue — reveals the profitability after operating expenses but before financing costs and taxes, showing how efficiently the business converts revenue to operating earnings), and the return on equity (net profit divided by shareholders’ equity — reveals how effectively the business is generating returns from the capital its shareholders have invested).
The profitability ratio comparison that most reveals whether a business is performing well or poorly: the comparison against industry benchmarks rather than against an absolute standard. The 3% net profit margin that is disappointing for a software business (where margins should be much higher) is excellent for a grocery business (where margins are typically very thin). The profitability ratio without an industry context benchmark is a number without a reference point; the ratio compared to the industry median and to the top quartile of performers in the same industry is a number that reveals the business’s competitive position.
Efficiency Ratios
The efficiency ratios that most clearly reveal how effectively the business uses its assets and manages its working capital: the inventory turnover (cost of goods sold divided by average inventory — reveals how many times per year the business sells and replaces its inventory; higher turnover indicates efficient inventory management and strong sales velocity), the accounts receivable days outstanding (accounts receivable divided by daily revenue — reveals how many days on average it takes to collect payment after a sale; lower days indicate faster cash conversion), and the asset turnover (revenue divided by total assets — reveals how efficiently the business generates revenue from its asset base; higher turnover indicates more efficient asset utilisation).
The efficiency ratio that most directly affects the business’s cash conversion cycle: the cash conversion cycle calculation (inventory days outstanding plus accounts receivable days outstanding minus accounts payable days outstanding) that reveals the number of days between when the business pays for inputs and when it collects cash from customers. The business with a long cash conversion cycle requires more working capital to sustain a given level of revenue than the business with a short cycle; improving the cash conversion cycle through faster inventory turnover, faster collections, or longer supplier payment terms can reduce the working capital requirement without changing the underlying revenue or profit.
Leverage Ratios and Financial Risk
The leverage ratios that most clearly reveal the business’s financial risk from its use of debt: the debt-to-equity ratio (total debt divided by shareholders’ equity — reveals the proportion of the business financed by debt versus equity; higher ratios indicate more leverage and more financial risk), the interest coverage ratio (operating profit divided by interest expense — reveals how many times the business’s earnings cover its interest expense; ratios below 2 indicate limited cushion against earnings decline), and the debt-to-EBITDA ratio (total debt divided by earnings before interest, tax, depreciation, and amortisation — a common measure of a business’s ability to repay its debt from operating earnings).
The leverage ratio interpretation that most requires industry context: the debt-to-equity ratio whose appropriate level varies enormously by industry. The capital-intensive utility company or real estate developer that operates effectively with a debt-to-equity ratio of 3 or higher would be considered dangerously leveraged for a software company or professional services firm that should operate with minimal or no debt. The leverage that is appropriate for a business with highly predictable, contractually committed revenue is dangerous for a business with cyclical or uncertain revenue — because the debt service obligation persists when revenue declines.